Max Temperature
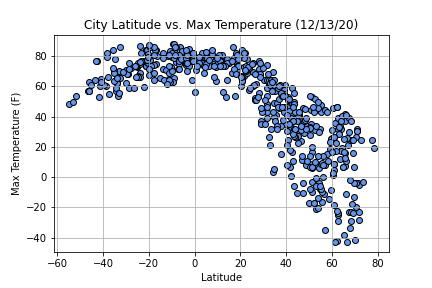
The Latitude vs. Temperature Plot plot shows that the temperatures in cities from the Northern Hemisphere tend to drop during the month of December 2020. The cities that are further north from the equator are colder. This plot shows there is a positive correlation between the Max Temperature and Latitude.
Visualizations