Cloudiness
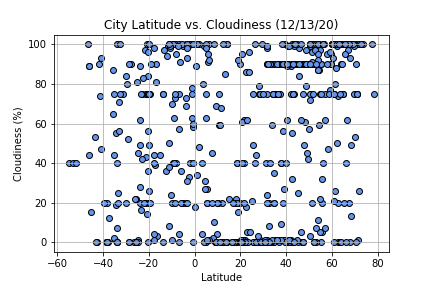
Latitude vs. Cloudiness Plot shows that the data points are spread out in the graph. This means there is no trend to the data; thus there is no correlation.
Visualizations
Cloudiness
Latitude vs. Cloudiness Plot shows that the data points are spread out in the graph. This means there is no trend to the data; thus there is no correlation.
Visualizations